Improve what you measure. Measure what you improve.
MONITOR AND ACT
ANALYZE AND IMPROVE
AUTOMATE
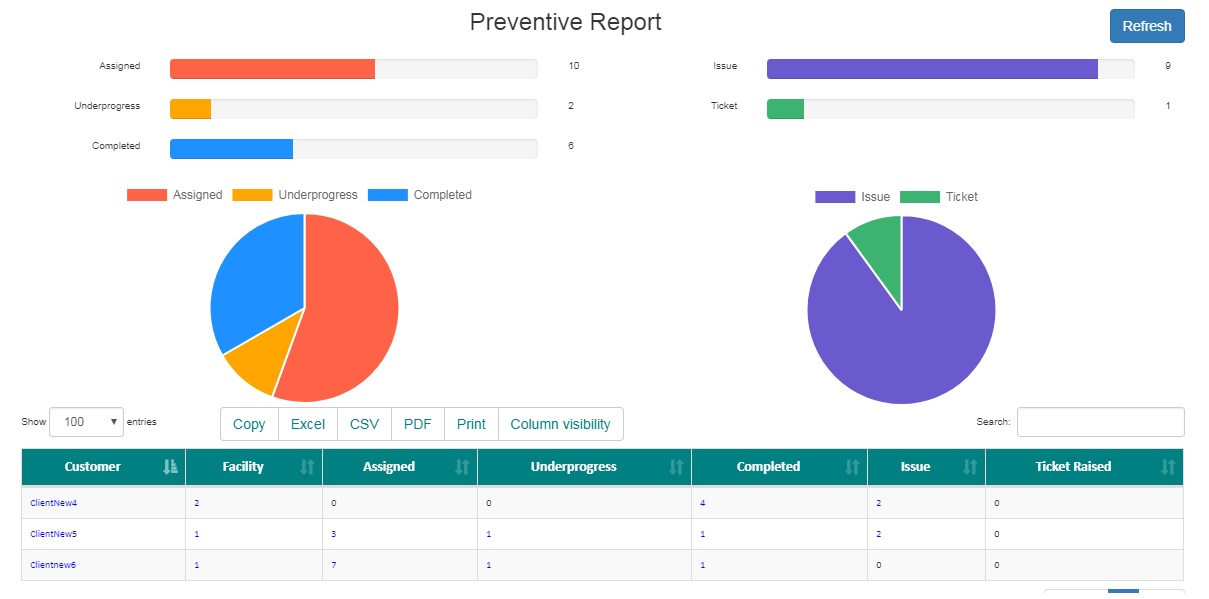
See the complete picture in a single window. Track all your key metrics for quick and agile decision making.
Understand the root causes of bottlenecks and other issues. Improve steadily with every ticket.
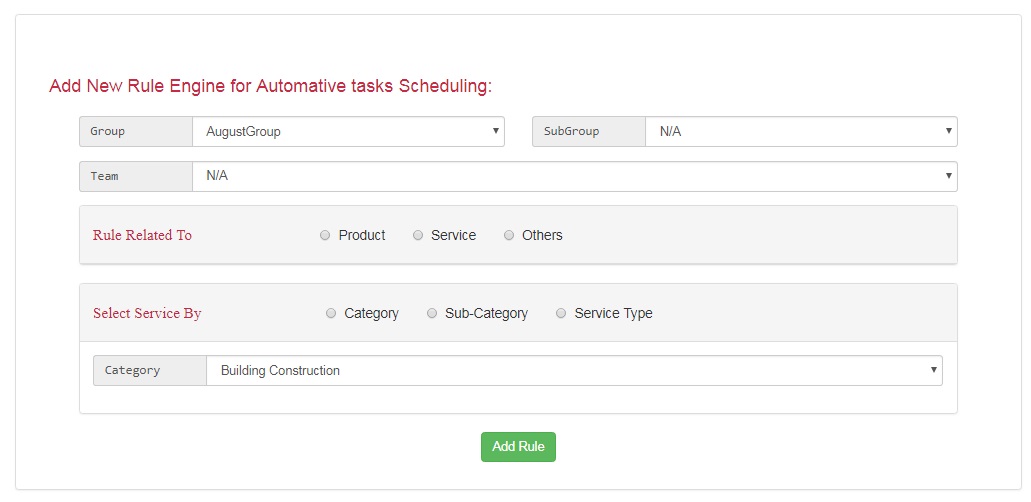
Save time and effort by creating rules to automate repetitive actions. Invest in better customer engagement instead.


Use detailed reports to understand your team's performance. Built-in dashboards help you track and improve your service using the most common metrics. Get additional statistics by creating your own reports as well.
The ticket overview is the gateway to all the stats available to you. In a single screen, you get the overall view because all the metrics you want to see first are displayed here.
Get live updates on your employees' availability. See who's offline, check on their most urgent tickets, and assign those tickets to other employees who are online.
FieldService gives you time-based reports, which include data like First Response Time, Average Response Time and Average Resolution Time. These can be filtered based on date, channel, and employee.
The employee Scorecard tracks all employee performance parameters, such as average response time, customer happiness, ticket traffic, and expertise. All of this is displayed in a single screen, along with employee information and current availability.
With Advanced Analytics, get access to all the pre-defined dashboards in Reports. This integration also lets you set up your own dashboards and share them with your team.
The Solutions Dashboard gives you the number of customers who have accessed your solution articles. This data can help you and your team improve your articles.
Fill out a form, Our representative will contact you
Thank You! Our Sales Team will Contact you as soon as possible.
Thank You! Our Sales Team will Contact you as soon as possible.